The current version of Odoo is Odoo 20, which is an ERP business platform where different apps, including Inventory, Sales, Purchase, Accounting, and Manufacturing, are incorporated into a single system. Reporting plays an informative role because of the implementation of the pivot view which is a tool that allows users to summarize their data. Moreover, with the help of this tool, users can group and filter the data. However, in some cases, users need their reports based on their custom SQL queries built on many tables. For example, the Inventory app allows analyzing stock moves, but it does not provide the picking overview with the number of moves, quantity, and delays at once. In this regard, it is convenient to create a custom report model based on the SQL query.
The blog post will describe the steps on how to build the Transfer Analysis report that will show every stock pick with its operation type, name of the partner, name of responsible user, number of moves, demand, quantities, and delay between the planned date and the real date of completion.
Creating the Model
Because we are using an SQL view rather than a regular Odoo model, we must define our model in such a way that does not result in a table being created in the database. We achieve this by setting _auto = False in the model definition. Each field in the model corresponds to a column fetched from the SQL query and all fields here are designated as being read-only because the data is produced by the database view itself, not inputted by users. The view is created in the init() function that is executed each time the module is installed or upgraded, meaning that it will always make use of the latest version of the query.
Python:
from odoo import fields, models, tools
from odoo.tools import SQL

class StockPickingPivotReport(models.Model):
    _name = 'stock.picking.pivot.report'
    _description = 'Transfer Analysis Report'
    _auto = False
    _rec_name = 'picking_id'
    _order = 'scheduled_date desc'
    picking_id = fields.Many2one('stock.picking', string='Transfer', readonly=True)
    partner_id = fields.Many2one('res.partner', string='Contact', readonly=True)
    picking_type_id = fields.Many2one('stock.picking.type', string='Operation Type', readonly=True)
    picking_type_code = fields.Selection([
        ('incoming', 'Receipt'),
        ('outgoing', 'Delivery'),
        ('internal', 'Internal Transfer'),
    ], string='Type of Operation', readonly=True)
    location_id = fields.Many2one('stock.location', string='Source Location', readonly=True)
    location_dest_id = fields.Many2one('stock.location', string='Destination Location', readonly=True)
    user_id = fields.Many2one('res.users', string='Responsible', readonly=True)
    company_id = fields.Many2one('res.company', string='Company', readonly=True)
    state = fields.Selection([
        ('draft', 'Draft'),
        ('waiting', 'Waiting Another Operation'),
        ('confirmed', 'Waiting'),
        ('assigned', 'Ready'),
        ('done', 'Done'),
        ('cancel', 'Cancelled'),
    ], string='Status', readonly=True)
    scheduled_date = fields.Datetime(string='Scheduled Date', readonly=True)
    date_done = fields.Datetime(string='Date of Transfer', readonly=True)
    move_count = fields.Integer(string='No. of Moves', readonly=True)
    product_qty = fields.Float(string='Demand Qty', readonly=True)
    quantity = fields.Float(string='Processed Qty', readonly=True)
    delay_days = fields.Float(string='Delay (Days)', readonly=True, aggregator='avg')
    late_count = fields.Integer(string='Late Transfers', readonly=True)
    def init(self):
        """Create the database view that feeds the transfer analysis report."""
        tools.drop_view_if_exists(self.env.cr, self._table)
        self.env.cr.execute(SQL(
            """
            CREATE OR REPLACE VIEW %s AS (
                SELECT
                    sp.id AS id,
                    sp.id AS picking_id,
                    sp.partner_id AS partner_id,
                    sp.picking_type_id AS picking_type_id,
                    spt.code AS picking_type_code,
                    sp.location_id AS location_id,
                    sp.location_dest_id AS location_dest_id,
                    sp.user_id AS user_id,
                    sp.company_id AS company_id,
                    sp.state AS state,
                    sp.scheduled_date AS scheduled_date,
                    sp.date_done AS date_done,
                    COUNT(sm.id) AS move_count,
                    COALESCE(SUM(sm.product_uom_qty), 0) AS product_qty,
                    COALESCE(SUM(sm.quantity), 0) AS quantity,
                    CASE
                        WHEN sp.date_done IS NOT NULL
                        THEN ROUND((EXTRACT(EPOCH FROM (sp.date_done - sp.scheduled_date)) / 86400)::numeric, 2)
                        ELSE 0
                    END AS delay_days,
                    CASE
                        WHEN sp.date_done > sp.scheduled_date THEN 1
                        WHEN sp.date_done IS NULL AND sp.state NOT IN ('done', 'cancel')
                             AND sp.scheduled_date < NOW() THEN 1
                        ELSE 0
                    END AS late_count
                FROM stock_picking sp
                JOIN stock_picking_type spt ON spt.id = sp.picking_type_id
                LEFT JOIN stock_move sm ON sm.picking_id = sp.id AND sm.state != 'cancel'
                GROUP BY sp.id, spt.code
            )
            """,
            SQL.identifier(self._table),
        ))
The init() method deletes any existing view of the same name using drop_view_if_exists() first, and then creates a new PostgreSQL view based on the SQL query. The query selects each transfer from the stock_picking table, joins it with stock_picking_type to identify the type of operation including receipt, delivery or internal transfer, joins it with the stock_move excluding cancelled moves, groups the moves by picking and provides the calculations of the number of moves, demand quantity and processed quantity. There are two calculated columns to make the output report more informative. The delay_days is counting how many days afterwards the expected date the transfer was executed, and due to the existence of aggregator='avg' the pivot view shows average value instead of total. In the late_count column, a transfer is considered late if the transfer is later than scheduled or has not been completed yet after the scheduled date. The complete SQL statement is encapsulated in the SQL class, which ensures it is safe and compatible with Odoo queries.
Creating the Views, Action and Menu
After preparing the model and SQL view, it is necessary to determine the method of displaying report data to users. Given that this is an analysis report, a pivot view is the primary method of presentation, with a chart view to facilitate visual comparisons and list view equipped with details at the transfer level. Moreover, a search view is available so that users may filter data using operation type or status and further group it by contact and responsible user or other fields. Lastly, a window action is responsible for opening all of the above-mentioned views and a menu item is responsible for making the report accessible under Inventory > Reporting.
xml:
<?xml version="1.0" encoding="UTF-8"?>
<odoo>
    <!-- Pivot view -->
    <record id="view_stock_picking_pivot_report_pivot" model="ir.ui.view">
        <field name="name">stock.picking.pivot.report.pivot</field>
        <field name="model">stock.picking.pivot.report</field>
        <field name="arch" type="xml">
            <pivot string="Transfer Analysis" sample="1">
                <field name="picking_type_id" type="row"/>
                <field name="scheduled_date" interval="month" type="col"/>
                <field name="move_count" type="measure"/>
                <field name="late_count" type="measure"/>
                <field name="delay_days" type="measure"/>
            </pivot>
        </field>
    </record>
    <!-- Graph view -->
    <record id="view_stock_picking_pivot_report_graph" model="ir.ui.view">
        <field name="name">stock.picking.pivot.report.graph</field>
        <field name="model">stock.picking.pivot.report</field>
        <field name="arch" type="xml">
            <graph string="Transfer Analysis" type="bar" sample="1">
                <field name="picking_type_id"/>
                <field name="late_count" type="measure"/>
            </graph>
        </field>
    </record>
    <!-- List view -->
    <record id="view_stock_picking_pivot_report_list" model="ir.ui.view">
        <field name="name">stock.picking.pivot.report.list</field>
        <field name="model">stock.picking.pivot.report</field>
        <field name="arch" type="xml">
            <list string="Transfer Analysis" create="0" edit="0" delete="0">
                <field name="picking_id"/>
                <field name="partner_id"/>
                <field name="picking_type_id"/>
                <field name="user_id"/>
                <field name="scheduled_date"/>
                <field name="date_done"/>
                <field name="move_count" sum="Total Moves"/>
                <field name="product_qty" sum="Total Demand"/>
                <field name="quantity" sum="Total Processed"/>
                <field name="delay_days" avg="Average Delay"/>
                <field name="state" widget="badge"/>
            </list>
        </field>
    </record>
    <!-- Search view -->
    <record id="view_stock_picking_pivot_report_search" model="ir.ui.view">
        <field name="name">stock.picking.pivot.report.search</field>
        <field name="model">stock.picking.pivot.report</field>
        <field name="arch" type="xml">
            <search string="Transfer Analysis">
                <field name="picking_id"/>
                <field name="partner_id"/>
                <field name="picking_type_id"/>
                <field name="user_id"/>
                <filter name="filter_receipts" string="Receipts"
                        domain="[('picking_type_code', '=', 'incoming')]"/>
                <filter name="filter_deliveries" string="Deliveries"
                        domain="[('picking_type_code', '=', 'outgoing')]"/>
                <filter name="filter_internal" string="Internal Transfers"
                        domain="[('picking_type_code', '=', 'internal')]"/>
                <separator/>
                <filter name="filter_done" string="Done"
                        domain="[('state', '=', 'done')]"/>
                <filter name="filter_late" string="Late"
                        domain="[('late_count', '=', 1)]"/>
                <separator/>
                <filter name="filter_scheduled_date" string="Scheduled Date" date="scheduled_date"/>
                <group>
                    <filter name="group_operation_type" string="Operation Type"
                            context="{'group_by': 'picking_type_id'}"/>
                    <filter name="group_partner" string="Contact"
                            context="{'group_by': 'partner_id'}"/>
                    <filter name="group_responsible" string="Responsible"
                            context="{'group_by': 'user_id'}"/>
                    <filter name="group_status" string="Status"
                            context="{'group_by': 'state'}"/>
                </group>
            </search>
        </field>
    </record>
    <!-- Action -->
    <record id="action_stock_picking_pivot_report" model="ir.actions.act_window">
        <field name="name">Transfer Analysis</field>
        <field name="res_model">stock.picking.pivot.report</field>
        <field name="view_mode">pivot,graph,list</field>
        <field name="search_view_id" ref="view_stock_picking_pivot_report_search"/>
        <field name="help" type="html">
            <p class="o_view_nocontent_smiling_face">
                No transfers found for the analysis.
            </p>
        </field>
    </record>
    <!-- Menu under Inventory > Reporting -->
    <menuitem id="menu_stock_picking_pivot_report"
              name="Transfer Analysis"
              parent="stock.menu_warehouse_report"
              action="action_stock_picking_pivot_report"
              sequence="50"/>
</odoo>
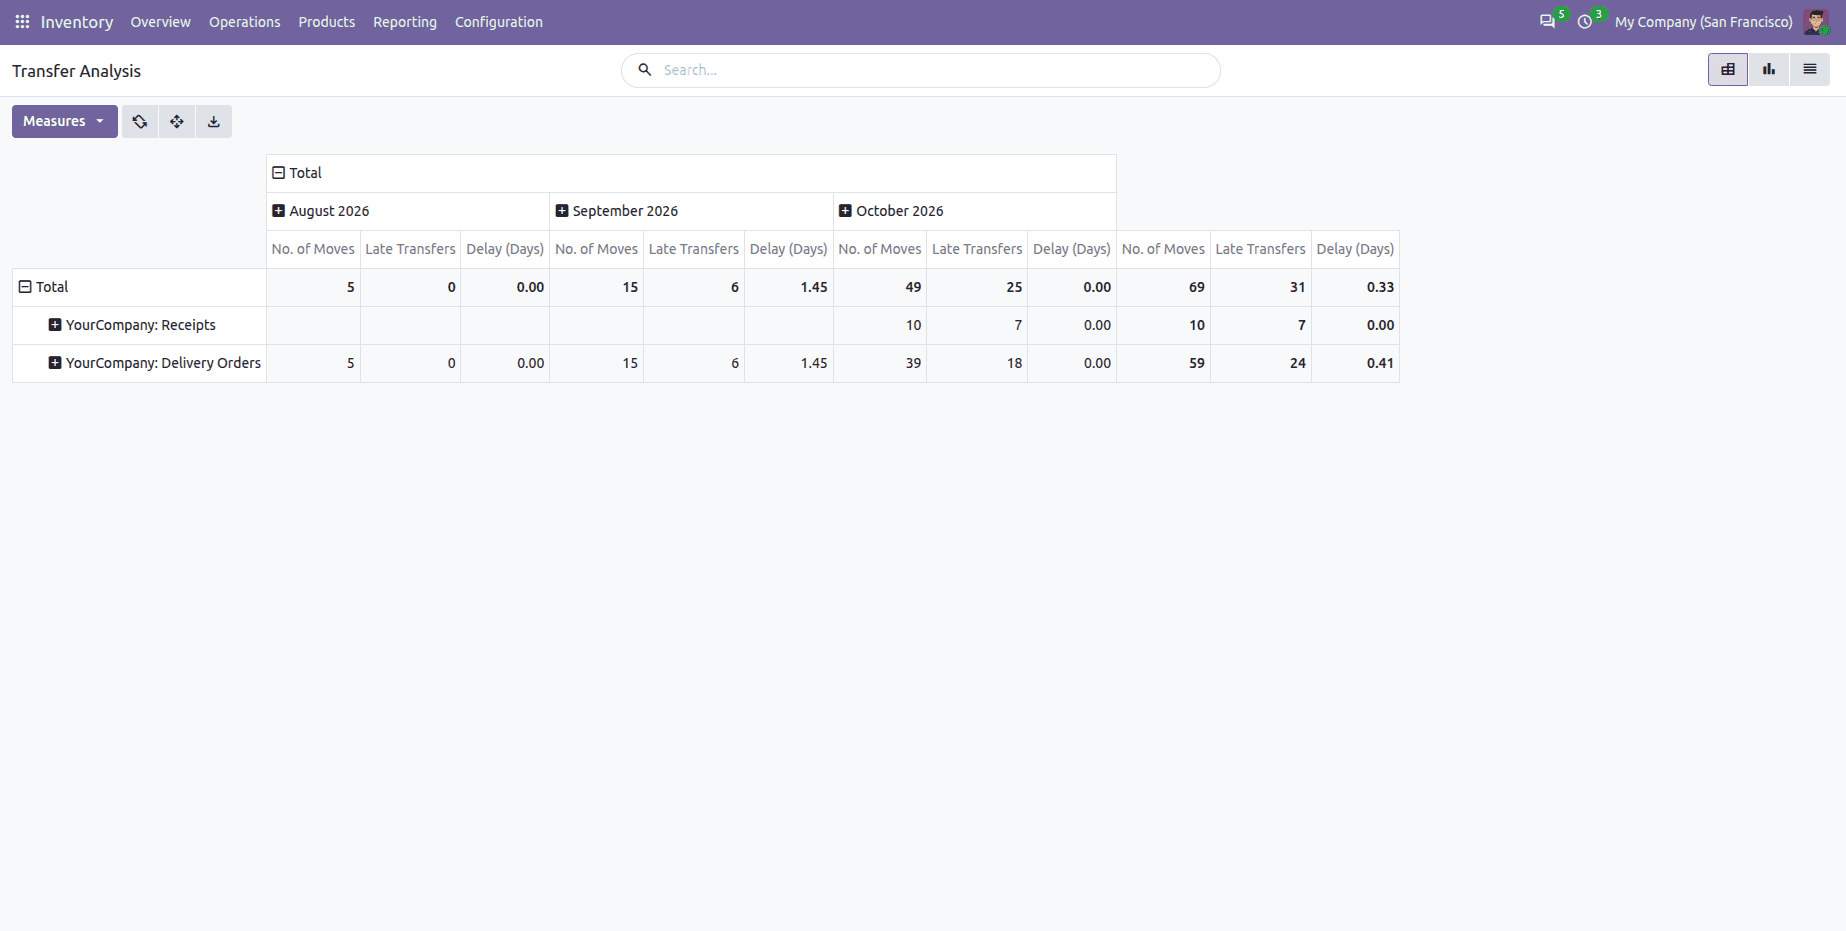
The pivot view is made with operation types on rows and scheduled dates on the columns grouped by month, while the default measures are moves, late transfers, and average delay. The graph view shows late transfers by operation type as a bar chart, allowing a quick visual comparison. The list view gives the details of each transfer, totals for moves and quantities with an average for the delay. There is no creation, editing, and deletion, as this form of data comes from a database view. The search view gives different instant filters for receipts, deliveries, internal transfer, completion and late transfers, a scheduled date filter, and a group by for operation type, contact, responsible user, and status. The window action opens the report in pivot view by default, while the menu item adds it under Inventory > Reporting, and it is called Transfer Analysis.
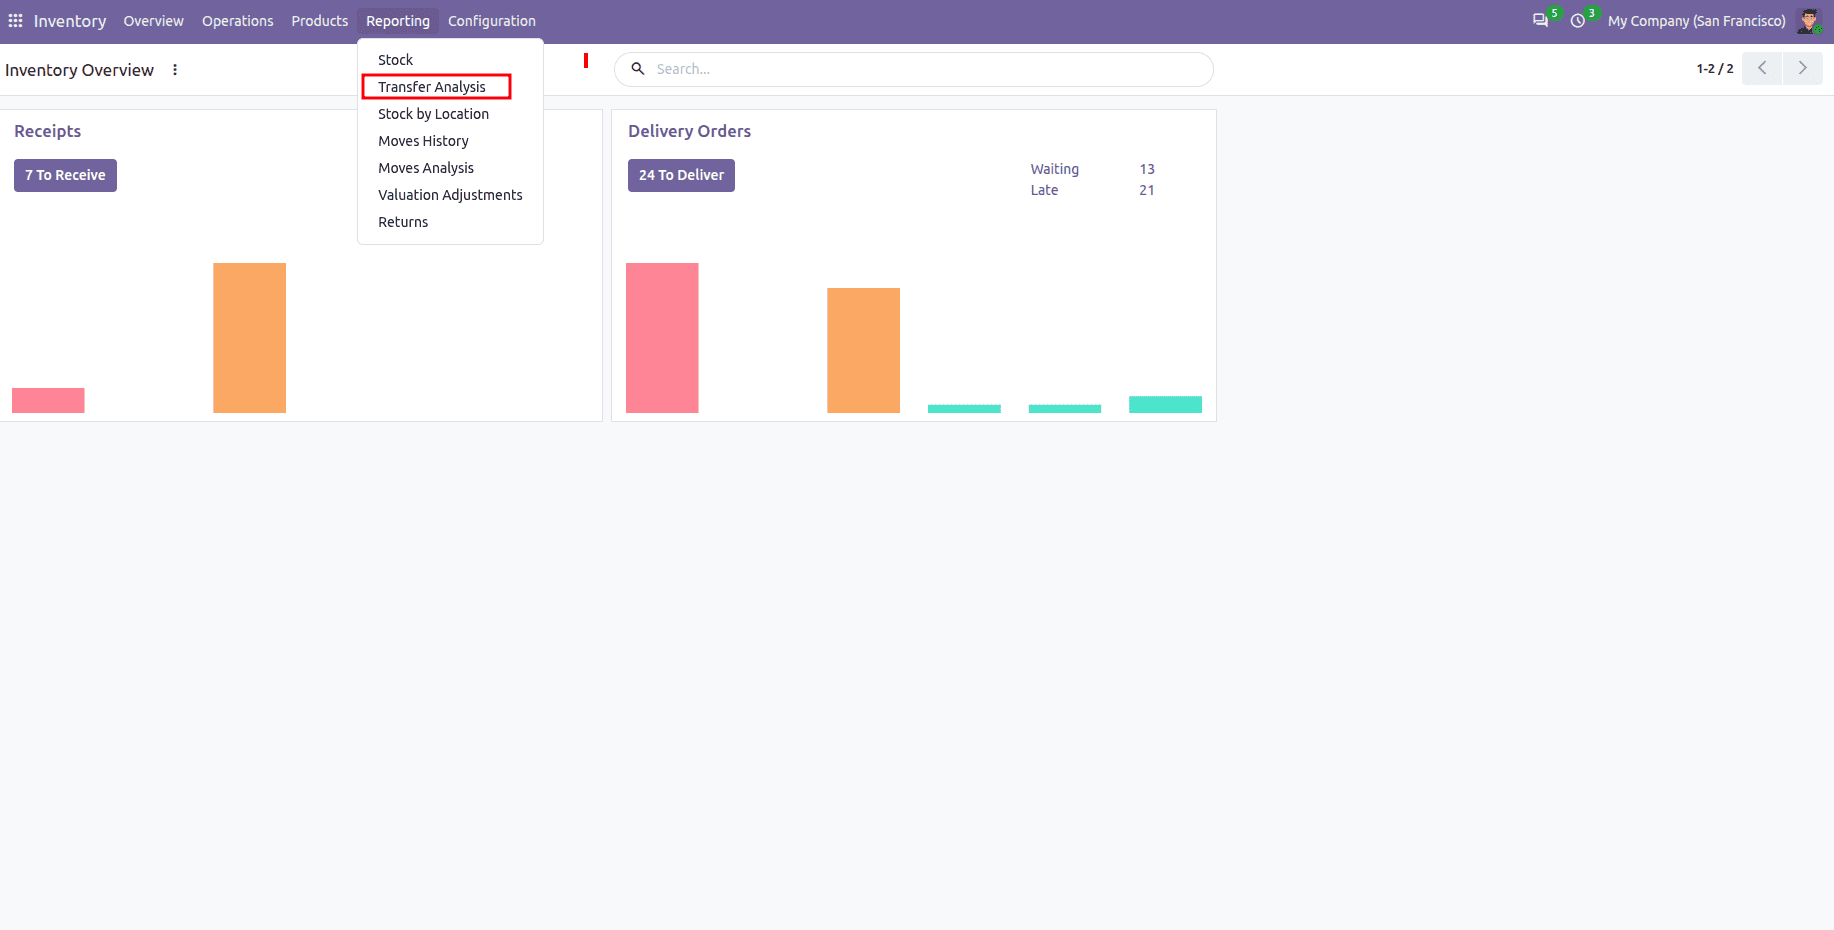
Following the installation of the module, the menu Transfer Analysis will come up in the navigation as part of Reporting under Inventory.
Opening the menu leads us to the pivot view that shows operation types in the row and scheduled dates in the column along with number of movements, amount of delayed transfers, and average delay per operation type.
By using the Delivery and Late filters and sorting by the Contact, one can instantly see which clients have the most delayed deliveries.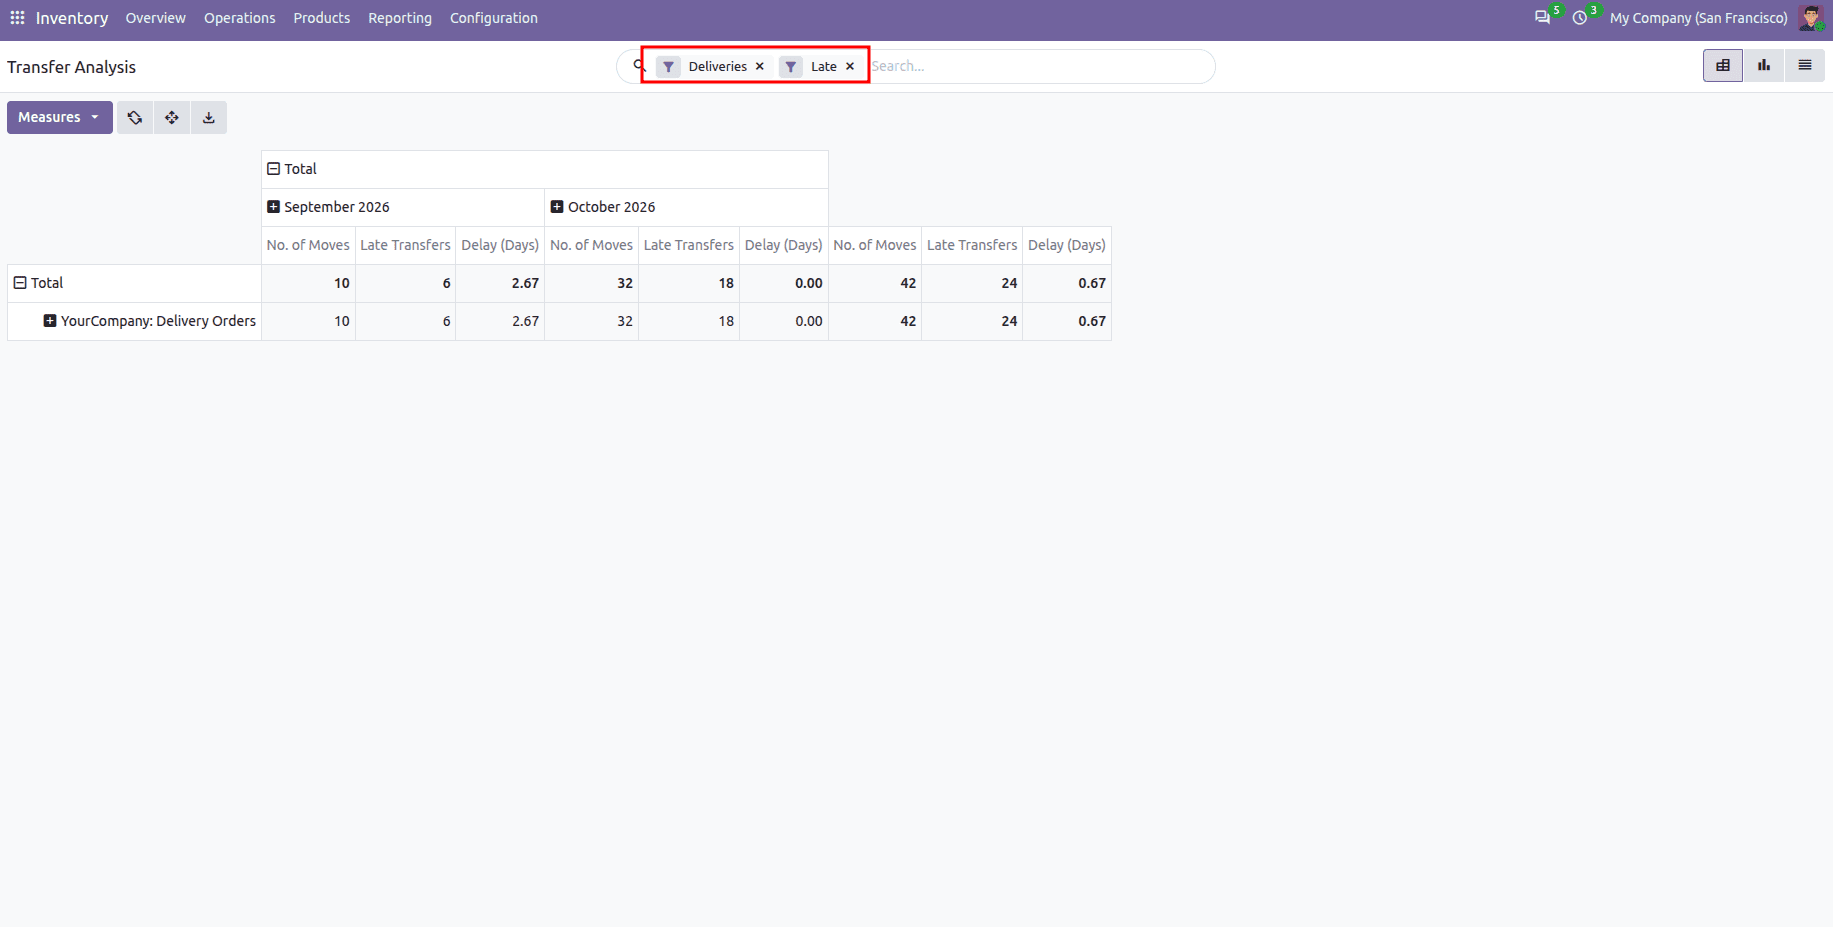
In the Measures dropdown menu, one can select which values will be seen in the report. Besides the pre-selected measures, one can use the Demand Qty, Processed Qty or Count values as well as take away any measure that isn’t needed. The pivot table updates on the fly, allowing the user to create customized reports of their own analysis without writing any actual code.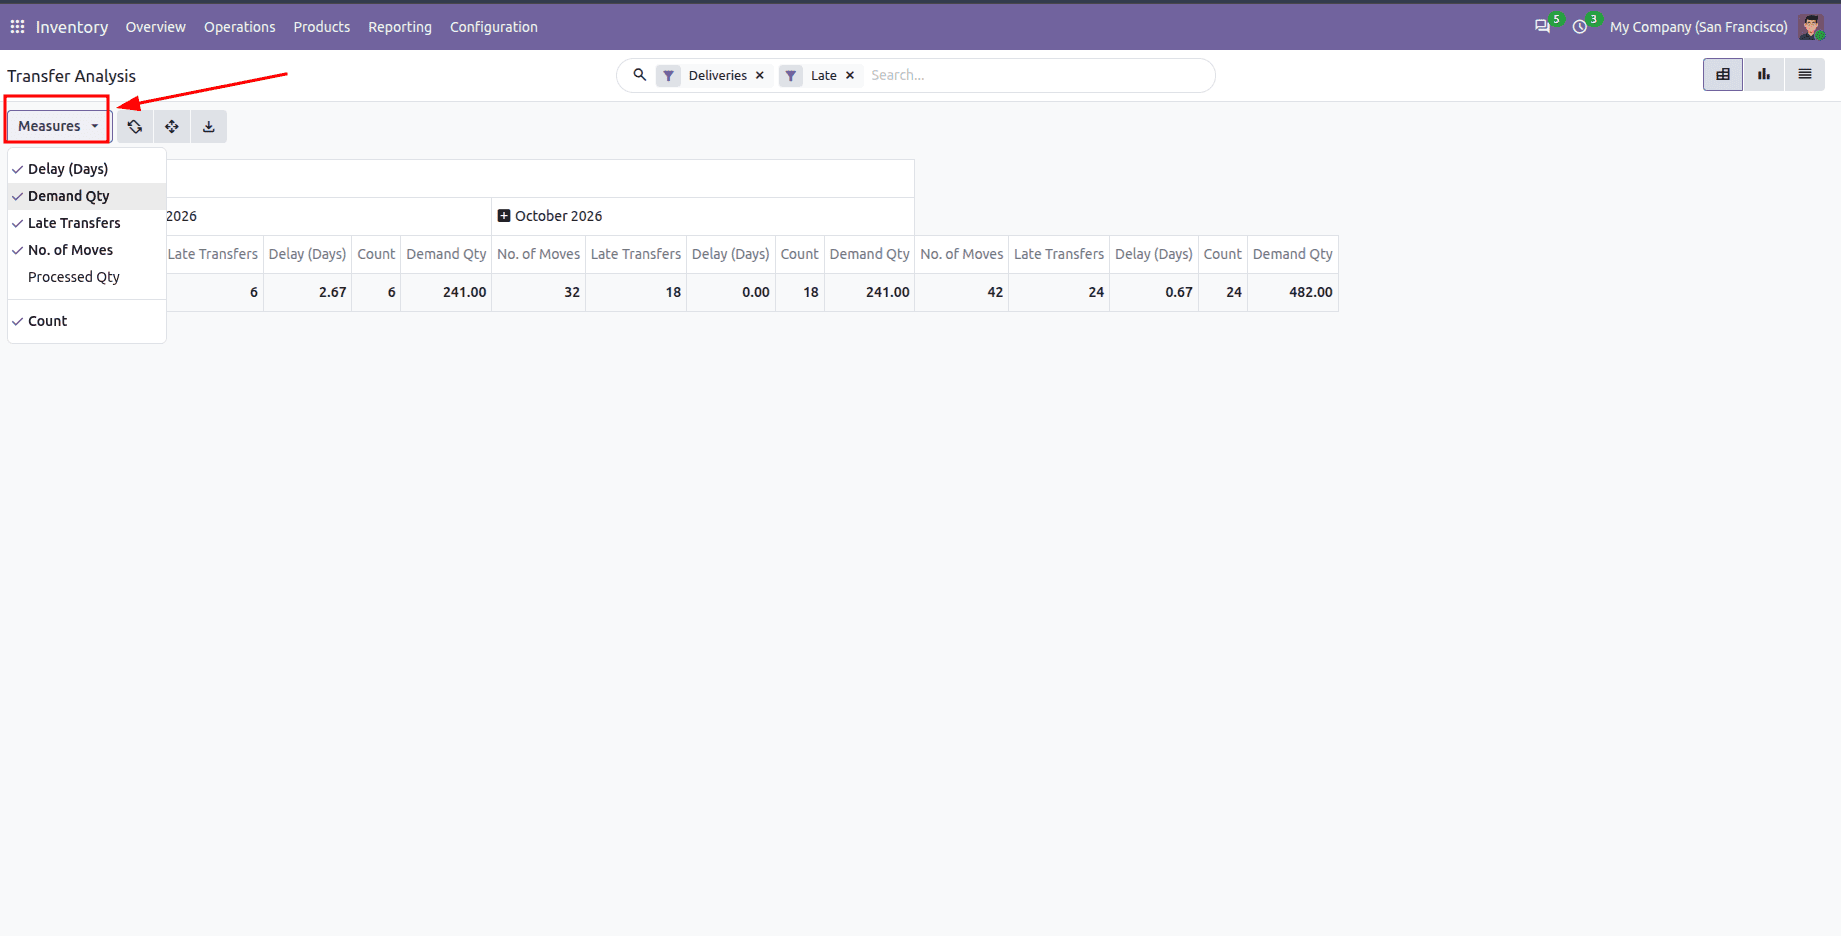
To sum up, constructing a pivot report through an SQL query in Odoo 20 provides warehousing teams insights into the effectiveness of their transfers. It incorporates picking, operations types, and stock moves into a unified database view that allows for displaying, for instance, counts and amounts of moves, their delays and late transfers alongside Odoo pivoting, filtering, grouping visuals. This method can serve as the basis for pivoting manufacturing orders, purchases receipts, bookkeeping records, and custom models etc.
To read more about How to Create a Pivot Report using Query in Odoo 19, refer to our blog How to Create a Pivot Report using Query in Odoo 19.