Project managers must make sure that each task is moving forward in accordance with the overall plan while teams work together on challenging assignments with short deadlines. This is where visual project tracking tools—which offer both raw data and real-time, intuitive insights into a project's performance become vital. The Burndown Chart is one such essential tool.
The Burndown Chart function in Odoo 19 is easily incorporated into the Project module, providing users with an instantaneous and clear view of the status of their project. The chart allows you to visually monitor task completion, compare it to your intended timeframe, and promptly discover areas of concern, whether you are managing internal activities or collaborating with external teams.
We'll examine the Burndown Chart in Odoo 19 in more detail in this blog, including how to use it and why it's a crucial tool for teams trying to enhance their project delivery and time management.
A graphical depiction of the amount of work left versus time is called a burndown chart. In agile project management, burndown charts are commonly used to predict project completion dates by analyzing current progress. The chart’s horizontal axis represents time, divided into days, weeks, or months, while the vertical axis displays the remaining workload, typically measured through tasks or story points.
A burndown chart's simplicity is its key component. The chart helps you quickly assess if your project is on schedule, delayed, or progressing faster than planned. It gives all stakeholders team members, project managers, and clients a clear picture of the project's health and does away with the need for drawn-out status meetings or intricate calculations. Rapid job completion is indicated by a steeply descending line on the chart; delays or stagnation are suggested by a flattening line.
The Burndown Chart is one of the more powerful project visualisation tools that Odoo 19's Project module has greatly enhanced. With the help of this feature, you can evaluate the productivity of your team over time and use visual performance indicators to make well-informed decisions.
Tracking Progress in Real Time and Aligning Teams
Instant clarity is one of the main benefits of using the Burndown Chart in Odoo 19. You may see how your project is doing right away without going into intricate reports or numerical analysis. This makes it possible to make decisions quickly and realign if needed.
For example, if you observe that the burn rate is slower than anticipated, it may indicate a delay in a specific job or stage. On the other hand, a higher burn rate than anticipated could be a sign of excellent performance or excessive resource commitment. The chart provides a clear visual overview, allowing all team members to stay updated on the project’s current condition. It encourages openness and keeps everyone motivated and accountable.
Simple Time Management and Forecasting
The Burndown Chart is a very useful tool for project completion predictions in addition to performance tracking. You can forecast whether the remaining work will be finished by the deadline by tracking the trend of completed jobs over time. Because of this, the chart is a very useful tool for controlling client expectations, modifying workloads, and fine-tuning project timelines. It doesn't require any extra software or connectors. Odoo 19's Burndown Chart is also among the most accessible and reasonably priced time management solutions. It provides smooth tracking and reporting inside the same environment since it is directly linked to the Odoo Project module.
Encouraging Openness and Cooperation
The shared visibility that the Burndown Chart generates among all stakeholders is another advantage. Clearer and more efficient communication occurs when all parties, including developers, team leads, and clients, have access to the same real-time project status. Additionally, it gives individual contributors the ability to assess their own pace and make necessary adjustments, determining whether the team is ahead of schedule or needs to accelerate.
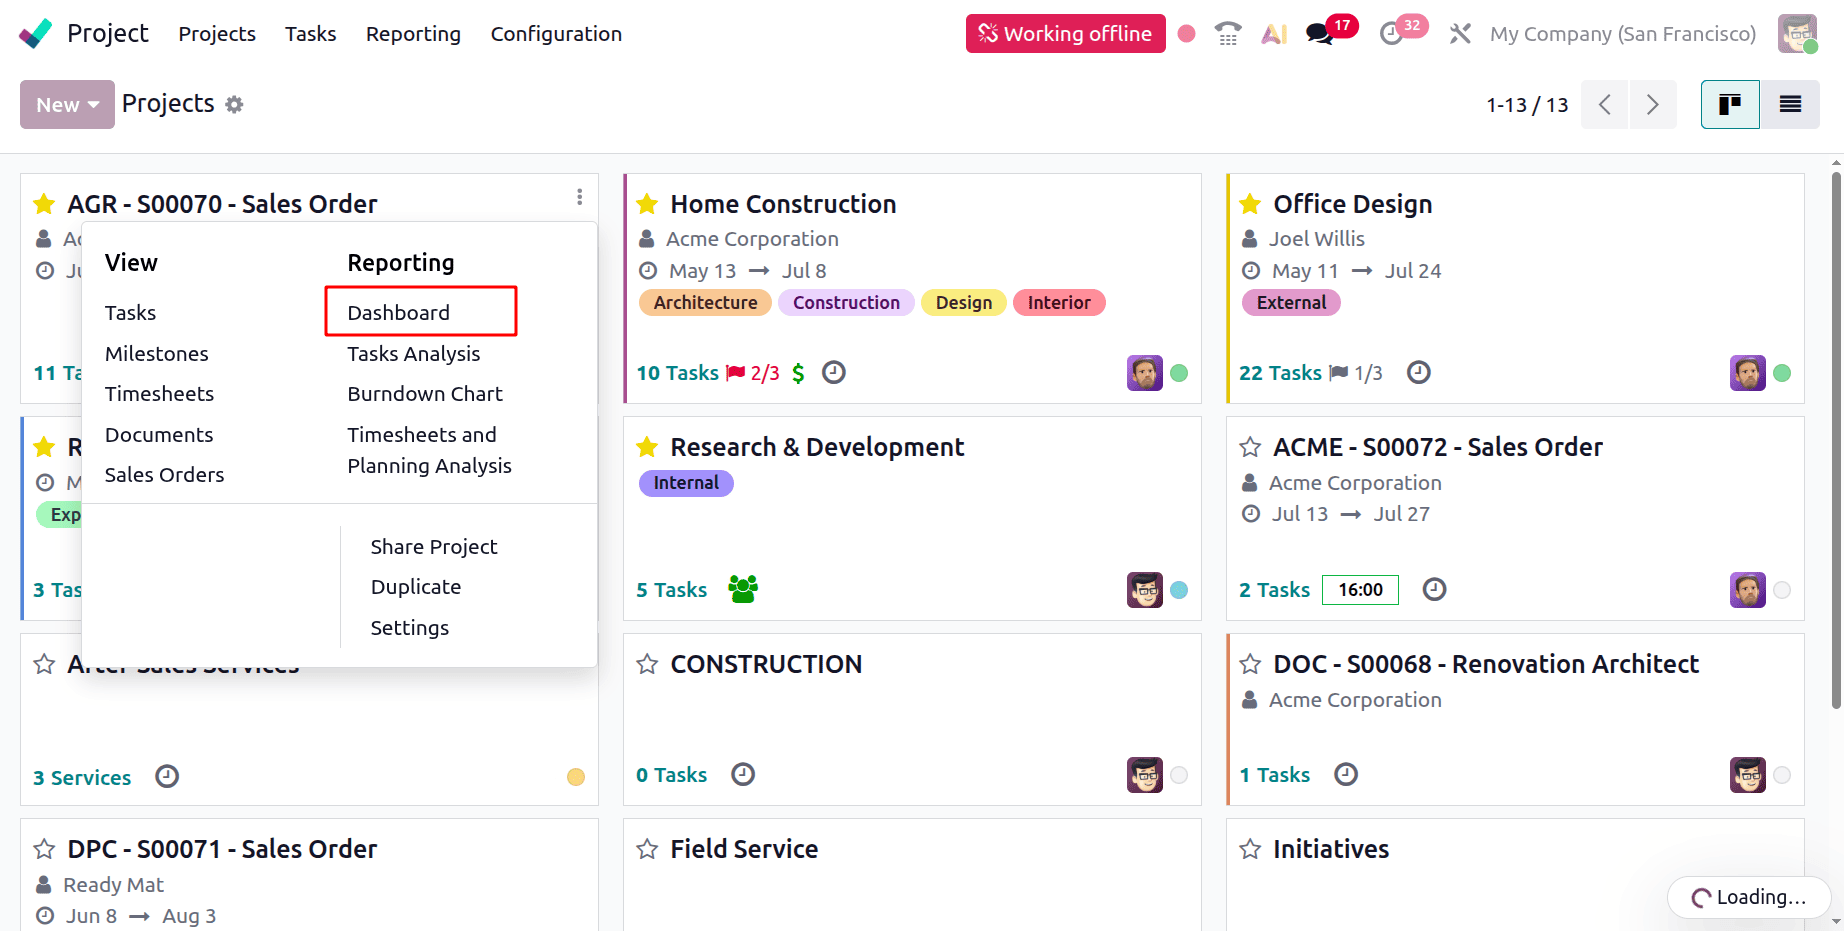
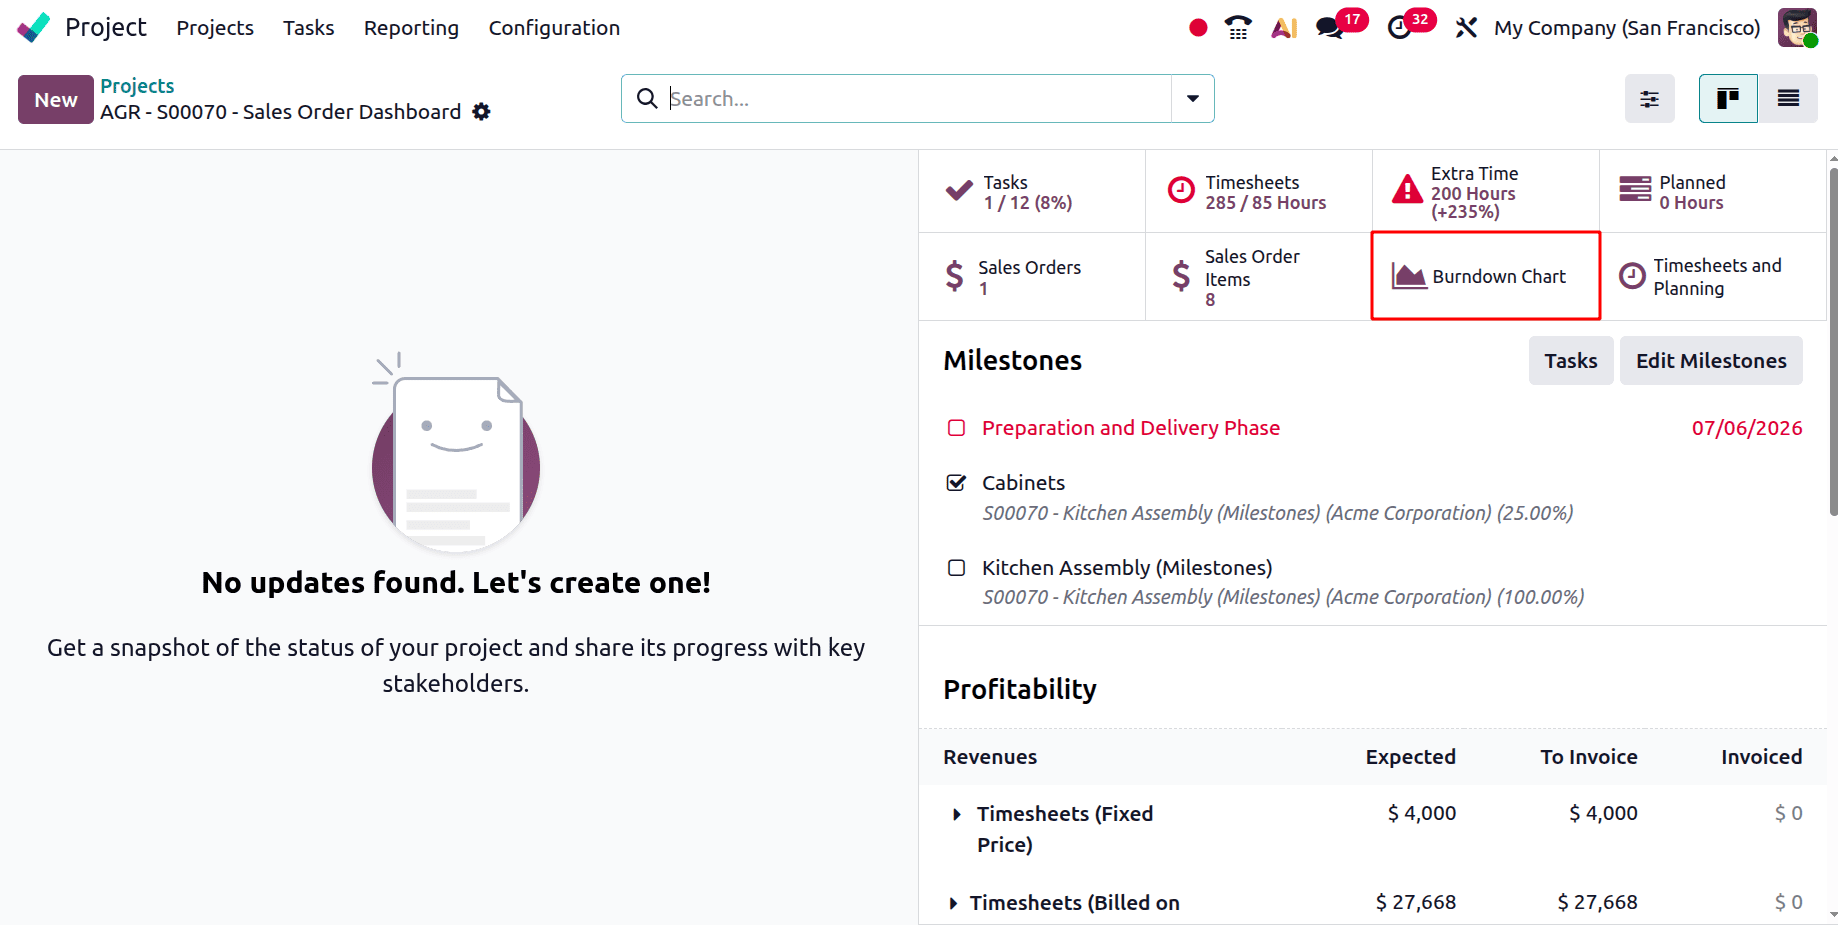
Go to the Project module in Odoo 19 and open the project’s Dashboard you wish to monitor progress for to get the Burndown Chart.
In the upper-right corner of the project dashboard, you will find several smart buttons. Select the "Burndown Chart" button to open the progress chart.
As an alternative, you can click on the three vertical dots in the upper-right corner of the particular project page to directly access the Burndown Chart.
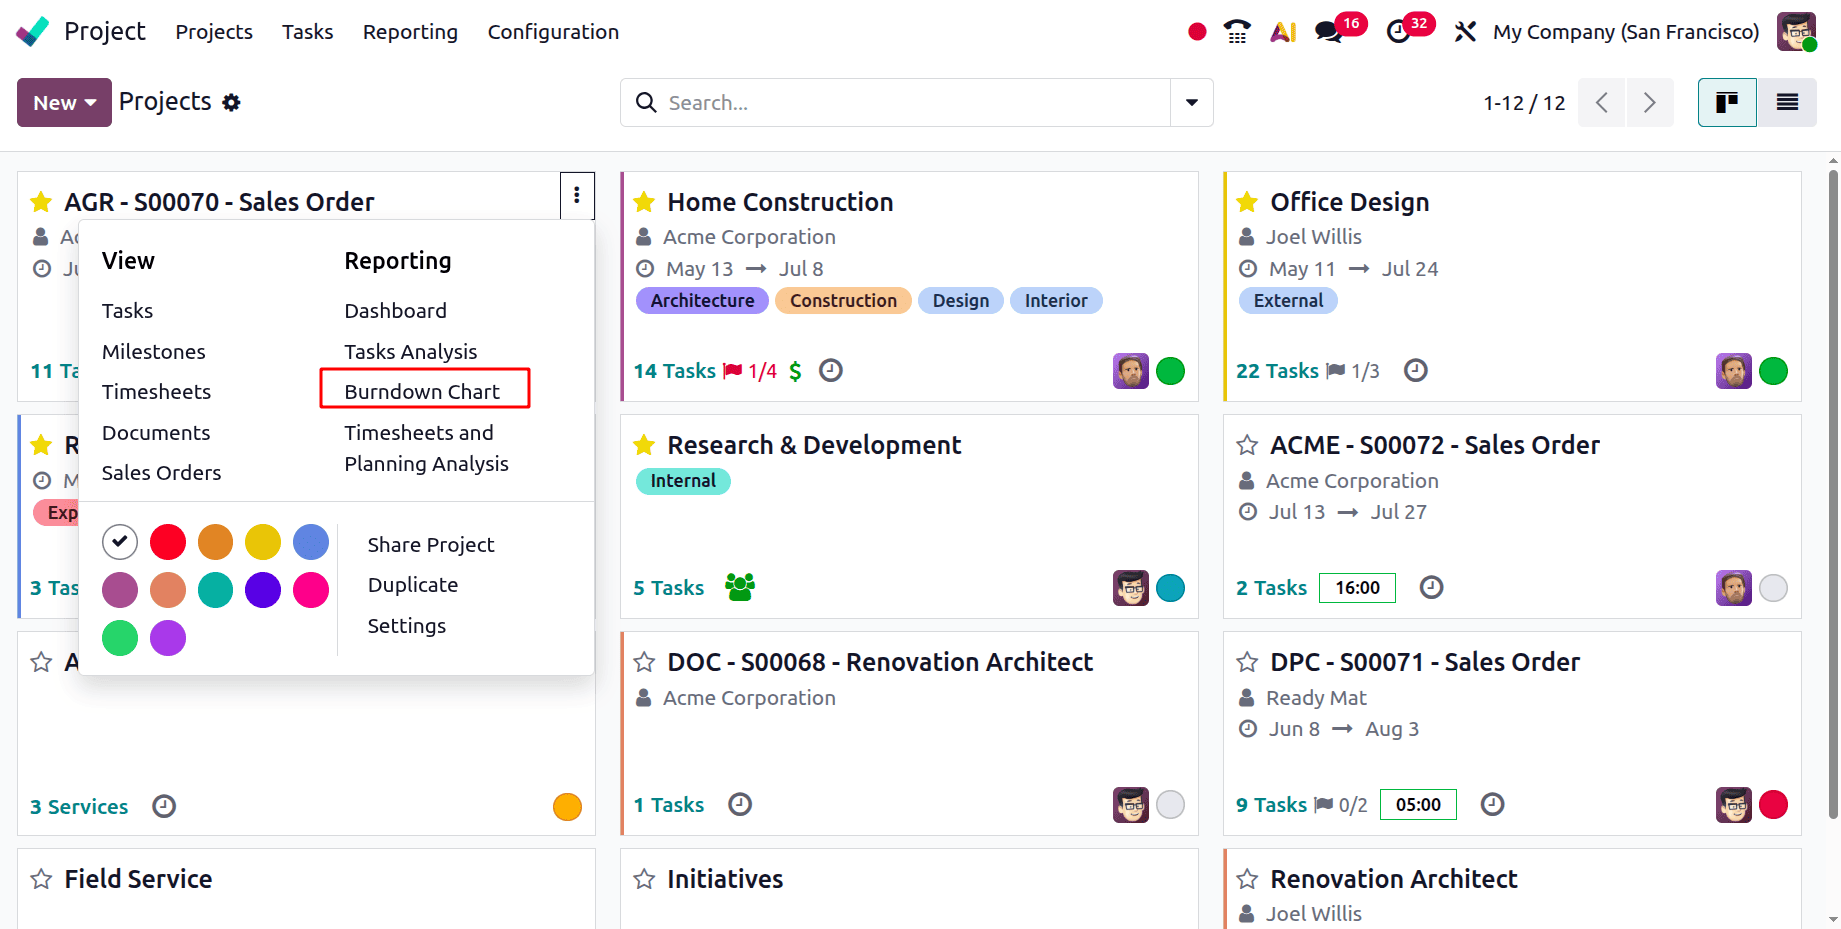
When you select this symbol, a list of project-related options is displayed in a drop-down menu. Selecting the "Burndown Chart" option allows you to quickly review a graphical representation of your project’s progress. Without leaving the current project interface, this offers a quick and easy way to view performance insights. With only a few clicks, this approach guarantees that you can keep an eye on your job completion trends and the overall project timeframe, as illustrated in the image.
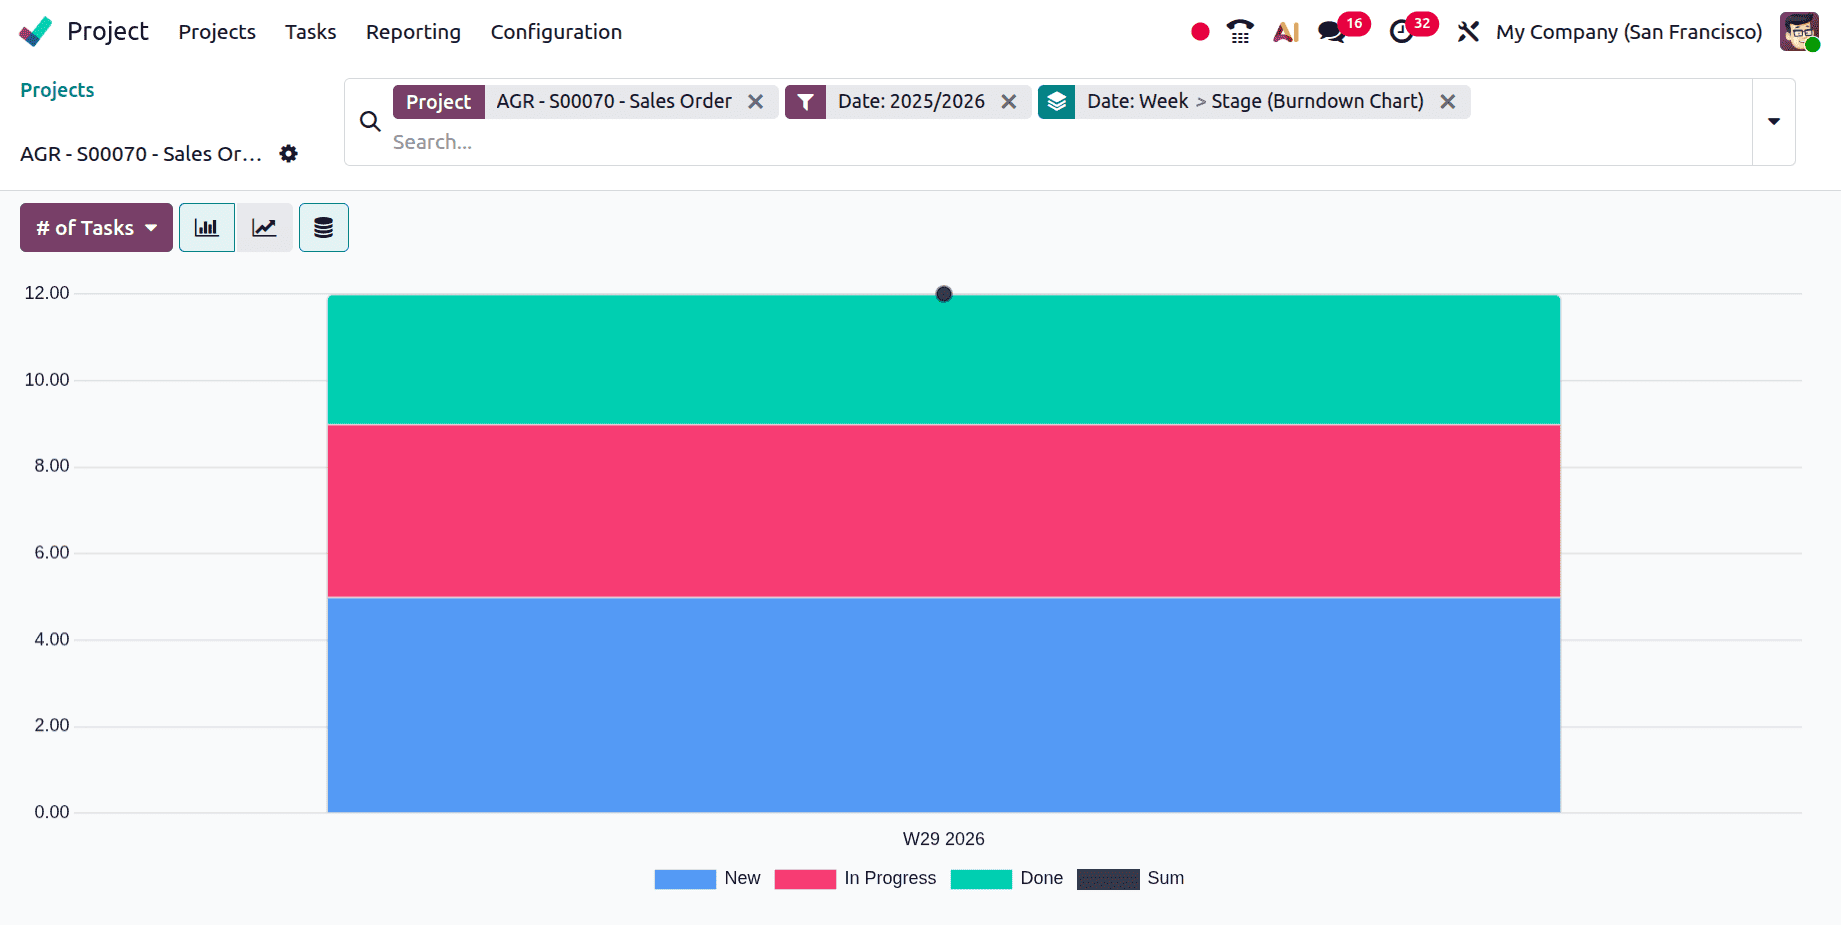
This chart offers a colour-coded representation of the project's phases, with each colour denoting a distinct step. It is simple to observe how many things were completed each month and how progress corresponds with your original timeline because completed tasks are clearly highlighted.
For teams looking to maintain clarity, increase productivity, and complete projects on schedule, the Odoo 19 Project module's Burndown Chart is a crucial tool. It is simpler to monitor progress, spot delays, and allocate resources optimally when there is a clear visual representation of the amount of work left compared to the time allotted. The integration with the Odoo ecosystem allows you to efficiently manage, track, and forecast projects from a single platform without switching between different tools. Odoo 19's Burndown Chart provides an intelligent, straightforward, and scalable solution for performance tracking, regardless of your level of experience as a project manager or your level of familiarity with agile project approaches.
To read more about An Overview of Burndown Chart in Odoo 18 Project, refer to our blog An Overview of Burndown Chart in Odoo 18 Project.